Bushfire App
Shiny application for tracking and analysing Australian bushfires (2019-2020) using spatial and satellite data.
Shinyapps
Source code
🔗 Bushfire
Motivations
How can we track, visualise and analyses the spatial temporal impact of bush-fires 🌲 🔥 using 🛰️ data?
The devastating impact of the Australian BushFires (2019-2020) on wildlife inspired me to contribute by raising awareness about bushfires and exploring how satellite data can be utilized effectively.
“Nearly 3 Billion Animals Impacted by the Australian Bushfires” — WWF
I developed a Shiny app that I built using R shiny earlier in 2020 and take you back in time to view and track the intensity of such an event. Hopefully while scrolling through this app you will be able to explore and understand the potential use of satellite data for such an event. Ultimately, my goal from this app is to communicate these findings and contribute to the collective efforts in addressing bushfires through increased awareness and informed decision-making.
PS: This app is dedicated to the kangaroos 🦘 and koalas 🐨 of Australia.
Description
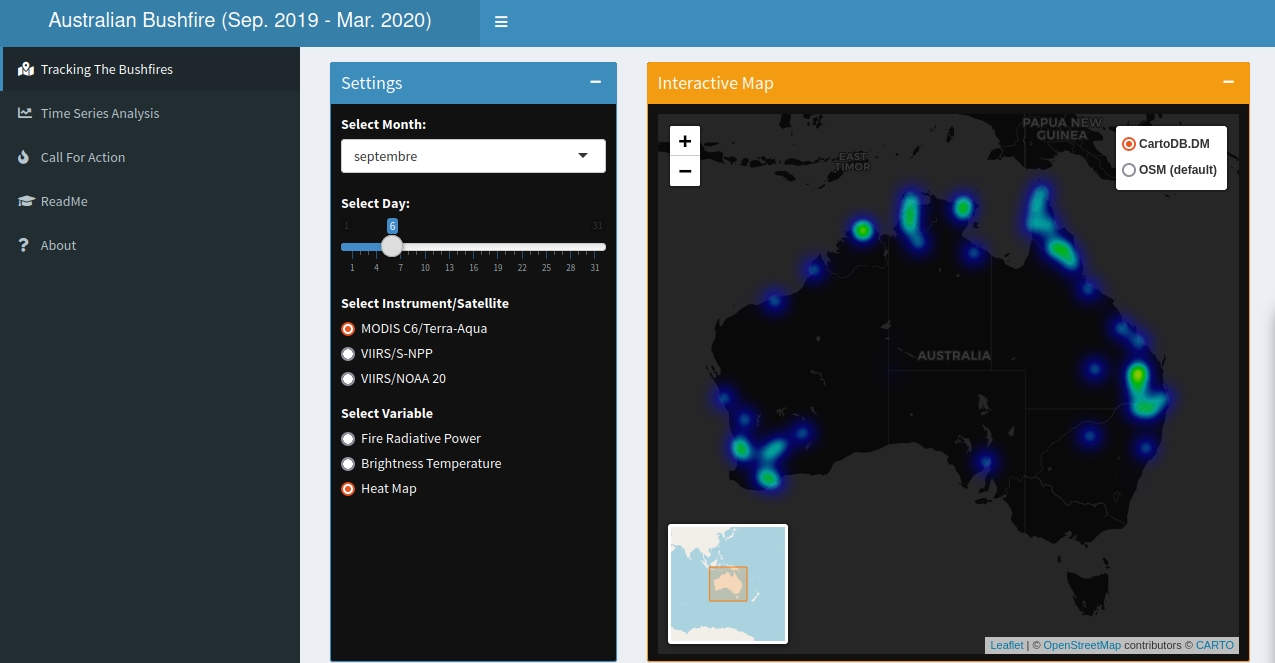
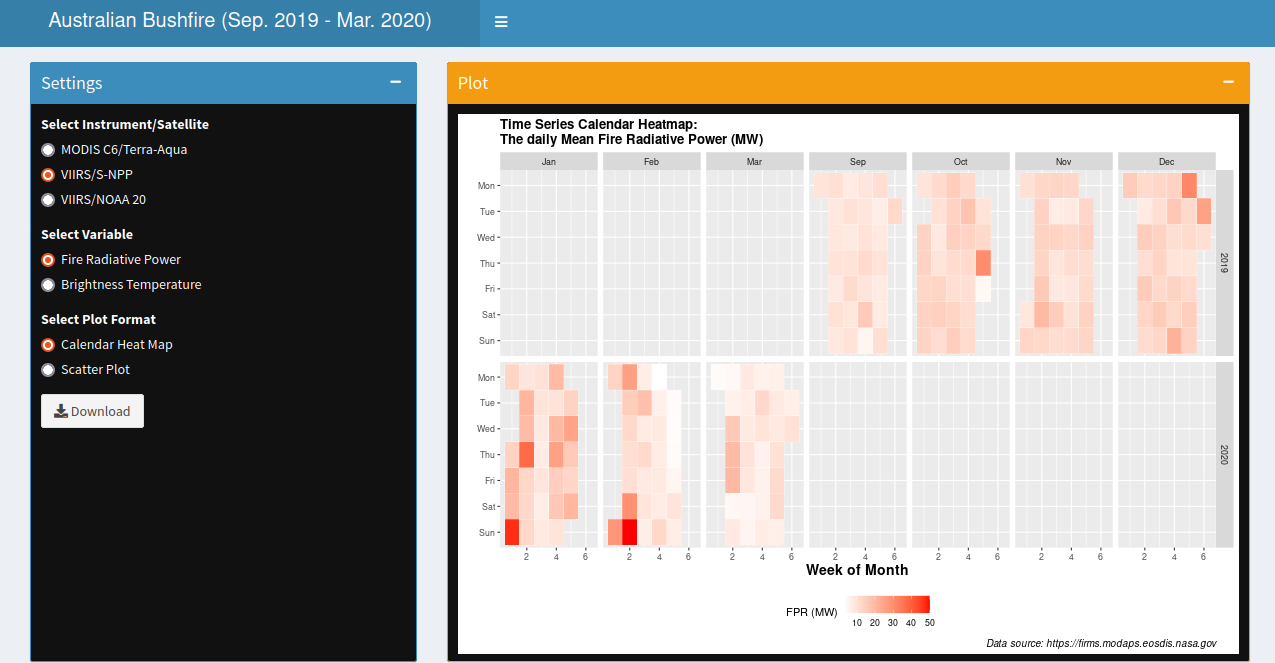
Tracking and Analysing the Spatial Temporal Variation of Australian Bushfire Season (2019-2020) Using MODIS and VIIRS Data. This app allows you to get an instant feedback about the impact and the spread of the fires. By leveraging satellite data, we can gain valuable insights into the extent of fire-affected areas and monitor their progression over time.
App Preview


---
Background image srource: Photo by Matt Palmer on Unsplash
---